Images

Infographic: Prescription drugs in the US

A great infographic about prescription drugs in the United States. Some highlights:

  • Prescription drugs account for 10 percent of the US health expenditures. Society must ensure that this money will be spent efficiently and effectively. To accomplish this, the level of medication adherence should be improved.
  • It’s not enough to register if a prescription is fulfilled. A control if and when medication has been taken by the patient is essential.
  • Patients with conditions like diabetes, hypertension and congestive heart failure benefit from taking prescribed medications; saving is $1.200 to $7.800 per patient annually.
  • 89.000 deaths prevented by high blood pressure medication.

Conclusion: medication adherence must be optimized. This is possible with a medication adherence support system or a prescription drug monitoring program!


Infographic Prescription Drugs Cost US

Infographic Prescription Drugs Cost US by Clarityway

Author: Indy Kavelaars @ Vitaphone Netherlands

Source: Clarityway

Tagged , , , , , ,

INFOGRAPHIC: Healthcare IT trends for 2014

Have a look at this great overview! Some highlights:

  • $36 billion will be saved, in the next 5 years, by utilizing remote monitoring in patients with cardiac & chronic diseases;
  • 1.3 million Americans will be treated via telehealth by 2017;
  • 81% of the healthcare providers plan to make future investments in telehealth.

Our message to healthcare community; don’t wait any longer! Start with the implementation of current available solutions. Let’s make Telehealth and Remote Monitoring reality…and not a promise in an infographic!


2014 Health IT Trends Infographic Healthcare

2014 Health IT Trends Infographic Healthcare

Source: CDW community

Tagged , , , , , , , ,

INFOGRAPHIC: mHealth

Have a look at this great infographic about the US physician use of mobile technology. Some striking figures:

  • Only 39% communicate online with patients;
  • 53% of all clinicians use tablets daily. That’s an increase of 19% in comparison with 2012;
  • 78% of the U.S. consumers are interested in mHealth solutions;
  • 88% of the doctors would like their patients to monitor their health at home, especially their weight, blood sugar and vital signs;
  • Only 28% of the smartphone users and 18% of the tablet users say that they are “very satisfied” with the quality of medical apps that are currently available;
  • 13% of the patients have accessed, stored or transmitted personal health information in the past year, 48% of them are interested in doing so;

Let’s face it: people are ready to use mhealth tools…and our tools are ready too!

Infographic mHealth physician use of mobile technology healthIT infographic

Infographic mHealth physician use of mobile technology healthIT infographic

Source: Strategy Business

Tagged ,

INFOGRAPHIC: Factors related to adherence

It’s good to have a clear view of all factors that influence medication adherence! A qualitative review of 102 studies resulted in very comprehensive Infographic. Let us have a further look at the demographic factors:

  • Age: most of the studies (14) show an increased compliance, some (3) a decreased and some (4) show no effect on compliance at elderly patients. With middle-aged or young patients, all (7) examined studies show a decreased compliance!
  • Ethnicity
    • Caucasian: All (4) studies show an increased compliance
    • Minorities: All (10) examined studies show no effect on compliance
  • Gender: Most studies (11) show an increased compliance, some (4) a decreased compliance and some(6) show no effect at female patients
  • Education level: only 2 studies show an decreased adherence, a few more (4) show an increase but the most (6) show no effect
  • Marital status: five studies show an increased adherence and the same amount of studies show no effect on adherence on married status

Possible conclusion: although medication adherence support systems like to focus on the elderly, this doesn’t seem to be the most important target! It’s much more appropriate to look at other factors.

Infographic-Adherence-Factors

Infographic-Adherence-Factors

Author: Indy Kavelaars @ Vitaphone Netherlands
Source: PMC, US national library of medicine

Tagged , ,

NHV Congres 2014

Vitaphone Nederland zal op zaterdag 22 maart opnieuw aanwezig zijn tijdens het congres van de Nederlandse Hartfunctie Vereniging. Dit congres vindt plaats in de ReeHorst te Ede. Wij zullen hier onze laatste ontwikkelingen demonstreren op het gebied van telemonitoring en tele-ECG.

NHV congres 2014

NHV congres 2014

Bekijk het programma >

Schrijf u nu in via www.roijecongressen.com

Tagged , , , ,

Infographic: Population Health Management

Another hot topic, intensively discussed in the healthcare community: Population Health Management(PHM). This HIN Infographic shows the benchmarks of their study. It’s no surprise to read the conclusion that successful PHM starts with the data and the data analysis. That means you need structured data and a system that understands the info that is gathered. See it as telemonitoring with a mobile ECG device: first you need to get the info (ecg) in, than you need to understand the data (is it an arrhythmic heart). Next step is a well-defined workflow to respond to the information. Example: after a brief contact with the patient it’s clear that the medication wasn’t taken in the way it should. With the PHM approach, 61% of the healthcare respondents expect an improvement of the medication adherence.

Don’t search any further for an easy way to improve medication adherence and the PHM approach; the PICO medication adherence support system….

Infographic Health managementSource: HIN

Author: Indy Kavelaars @ Vitaphone Netherlands

Tagged , , ,

US Hospitals will be required to verify medication through bar codes

Patient safety experts press US government to increase bar code threshold for hospital medications.

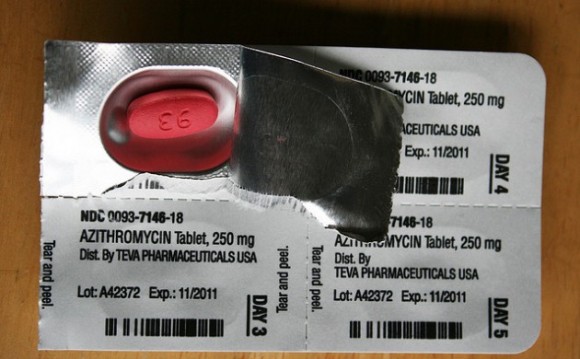
In 2014 the US hospitals must verify 10% of their medication orders. We believe this percentage is far too low. For patient security, why not barcode all medication? The last barcode check can be done just before the medication will be taken. Some people think it should look like this:

medication-barcode-image

medication-barcode-image

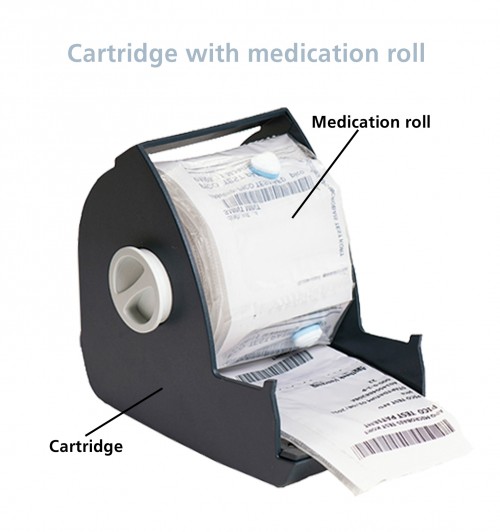
But what if the patient has more than one type of medicine? Scanning all medication is very inefficient! This is why Vitaphone supports prepackaged medication on the PICO medication roll. Every intake moment is now barcoded and it looks like this:

Cartridge medication roll

Cartridge medication roll

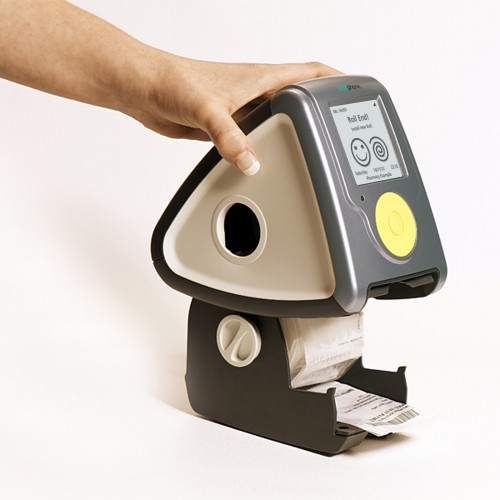
The medication roll is situated on a cartridge so it can be easily installed in the PICO. The PICO reads the barcodes when the medication is taken from the roll and checks if this is the right medication at the right time for the right person. If this is not the case it will alert the user and the healthcare professional.

vitaphone_PICO_medication

Vitaphone PICO medication adherence support system

Go to www.picocare.com for more information or contact Vitaphone!

The instruction presentation is available at www.picocare.com/en/how-to-use-the-pico

Author: Indy Kavelaars @ Vitaphone Netherlands

Source: HealthbizDecoded & CDWcommunit

Tagged , ,

Infographic: Reducing readmissions

The infographic of today is about reducing readmissions. As of October 2012, Centers for Medicare & Medicaid Services(CMS) penalizes hospitals for excess readmission rates. Some interesting facts:

  • The states with a readmission rate more then 19% are: Nevada, Texas, Oklahoma, Kansas, Arkansas, Louisiana, Kentucky, West Virginia, Ohio, Maryland, Michigan, Pennsylvania, Massachusetts.
  • 11% of the readmissions are due to medication non-adherence at a cost of nearly $100 billion annually.
  • Survey opportunities to reduce readmissions: Disease Management and Medication Reconciliation.

When does government finance the implementation of these opportunities to reduce readmissions? Vitaphone has the solutions ready for worldwide installation!

Author: Indy Kavelaars @ Vitaphone Netherlands

Reducing readmissions-Infographic

Reducing readmissions-Infographic

Tagged , , , ,

Infographic: Healthcare is huge!

This infographic shows how big the healthcare industry is in the United States. What is interesting to look at?

  • In 2011 the total healthcare spending was 2.7 trillion and it is expected to double in the next decade
  • The amount of spending on healthcare technologies is increasing
  • Technology is changing the way healthcare is provided and administered
  • Reducing operational/overhead costs, increasing staff productivity, increasing patient satisfaction and improving workflow efficiency are the top priorities

US Healthcare providers rank ‘continuing medical education’ as most appealing use of Telemedicine. It seems these providers need to have a look (again) at the real definition of Telemedicine! And they will find new opportunities to reduce costs, increase productivity, efficiency & patient satisfaction!

Infographic: Healthcare is huge!

Infographic: Healthcare is huge!

Author: Indy Kavelaars

Source: CompTIA

Tagged , ,